The short version
Dealerships in an automaker’s certified pre-owned (CPO) program were watching their participation rates drop, and they didn’t know why. That rate determined whether they stayed in the program and how much they paid in fees, so not knowing why could cost them.
I designed a Dealer Participation Rate experience inside the automaker’s internal certification platform. It shows dealers and the people who support them what goes into their rate, where they stand this quarter, and what it’ll take to reach the next tier.
I also went beyond the brief. The requirements asked me to explain the rate, and I designed ways to show dealers how close they were to their next goal, for them and for the District Zone Managers who coach them.
The challenge
One of the platform’s most important numbers was the participation rate: the share of a dealer’s eligible inventory that gets certified. Dealers thought they were meeting their quotas, but their rates kept going down. The program’s lead manager kept getting the same questions, and dealers wanted two things:
- To understand how the automaker was calculating their rate
- To trust that it was calculated the same way for everyone
They had good reason to ask. Because of a backend issue, dealers sometimes saw two different rates depending on where they looked. The rate also mattered from day one: a new dealer couldn’t launch in the program with less than 60% of their eligible inventory participating.
Business problem: Bring clarity and transparency to dealers’ participation rates, which directly impact program eligibility and fees.
Product requirements: Show the data behind the calculation (numerator, denominator, and percentage), integrate it into the existing platform, and make it actionable during onboarding and beyond.
Designing for the people who coach dealers
My four business stakeholders were also users of the platform: the program’s lead manager, a day-to-day lead who made most decisions, and two people who helped dealers troubleshoot. One of them pointed me to the District Zone Managers (DZMs), a group recently onboarded onto the platform. DZMs are the field reps who manage the dealerships in their district, enroll new dealers, and keep them engaged. I advocated for bringing three of them into research and testing, because they worked directly with dealers and heard their questions every day.
Instead of only asking what they wanted, I looked at what they were trying to do:
- I looked past the literal request. Users said they wanted to “understand the calculation,” and the business took that literally, which is how V1 ended up showing the formula. But users didn’t want the algebra. They wanted to know which vehicles were being counted and how to fix the ones that weren’t.
- I made every number traceable. People were doing detective work to figure out why a dealer’s number was off, so I linked every count to the vehicles behind it.
- I gave them context to coach with. A regional average let a DZM show a dealer how they compared to others nearby, which added a little healthy competition.
The idea nobody asked for
The requirements asked me to make the rate understandable. But understanding the number wasn’t the end goal. The fee tiers were there to motivate dealers to certify more inventory. Dealers wanted to pay less. DZMs wanted their dealers to move up a tier.
So I changed the question from “how do we explain this rate?” to “how do we help dealers improve it?” My answer was to show them how close they were to their goal, with two pieces of information:
- How much time is left: days until the end of the quarter, when fees were set
- How far there is to go: units needed to reach the next tier
Later I added Potential Savings, to show what reaching that tier was worth.
Beyond explaining the rate, I showed dealers how close they were to the next tier: days left in the quarter, units to go, and what it would save them.
None of this was in the requirements, and it’s what the DZMs got most excited about. For the first time, they had specific numbers they could take to a dealer to motivate them.
I really like the ‘Days Till EOQ’ and ‘To Next Tier’ tile because it lets me know how close I am, and I can take that information to the Dealers to motivate them.
District Zone Manager
The process
V1: Every dealership at once
My first version took the request literally: if people don’t understand the calculation, show them the calculation. It listed every dealership with its rate, certified and eligible vehicle counts, and a warning flag for dealers below the threshold, with the formula spelled out alongside.
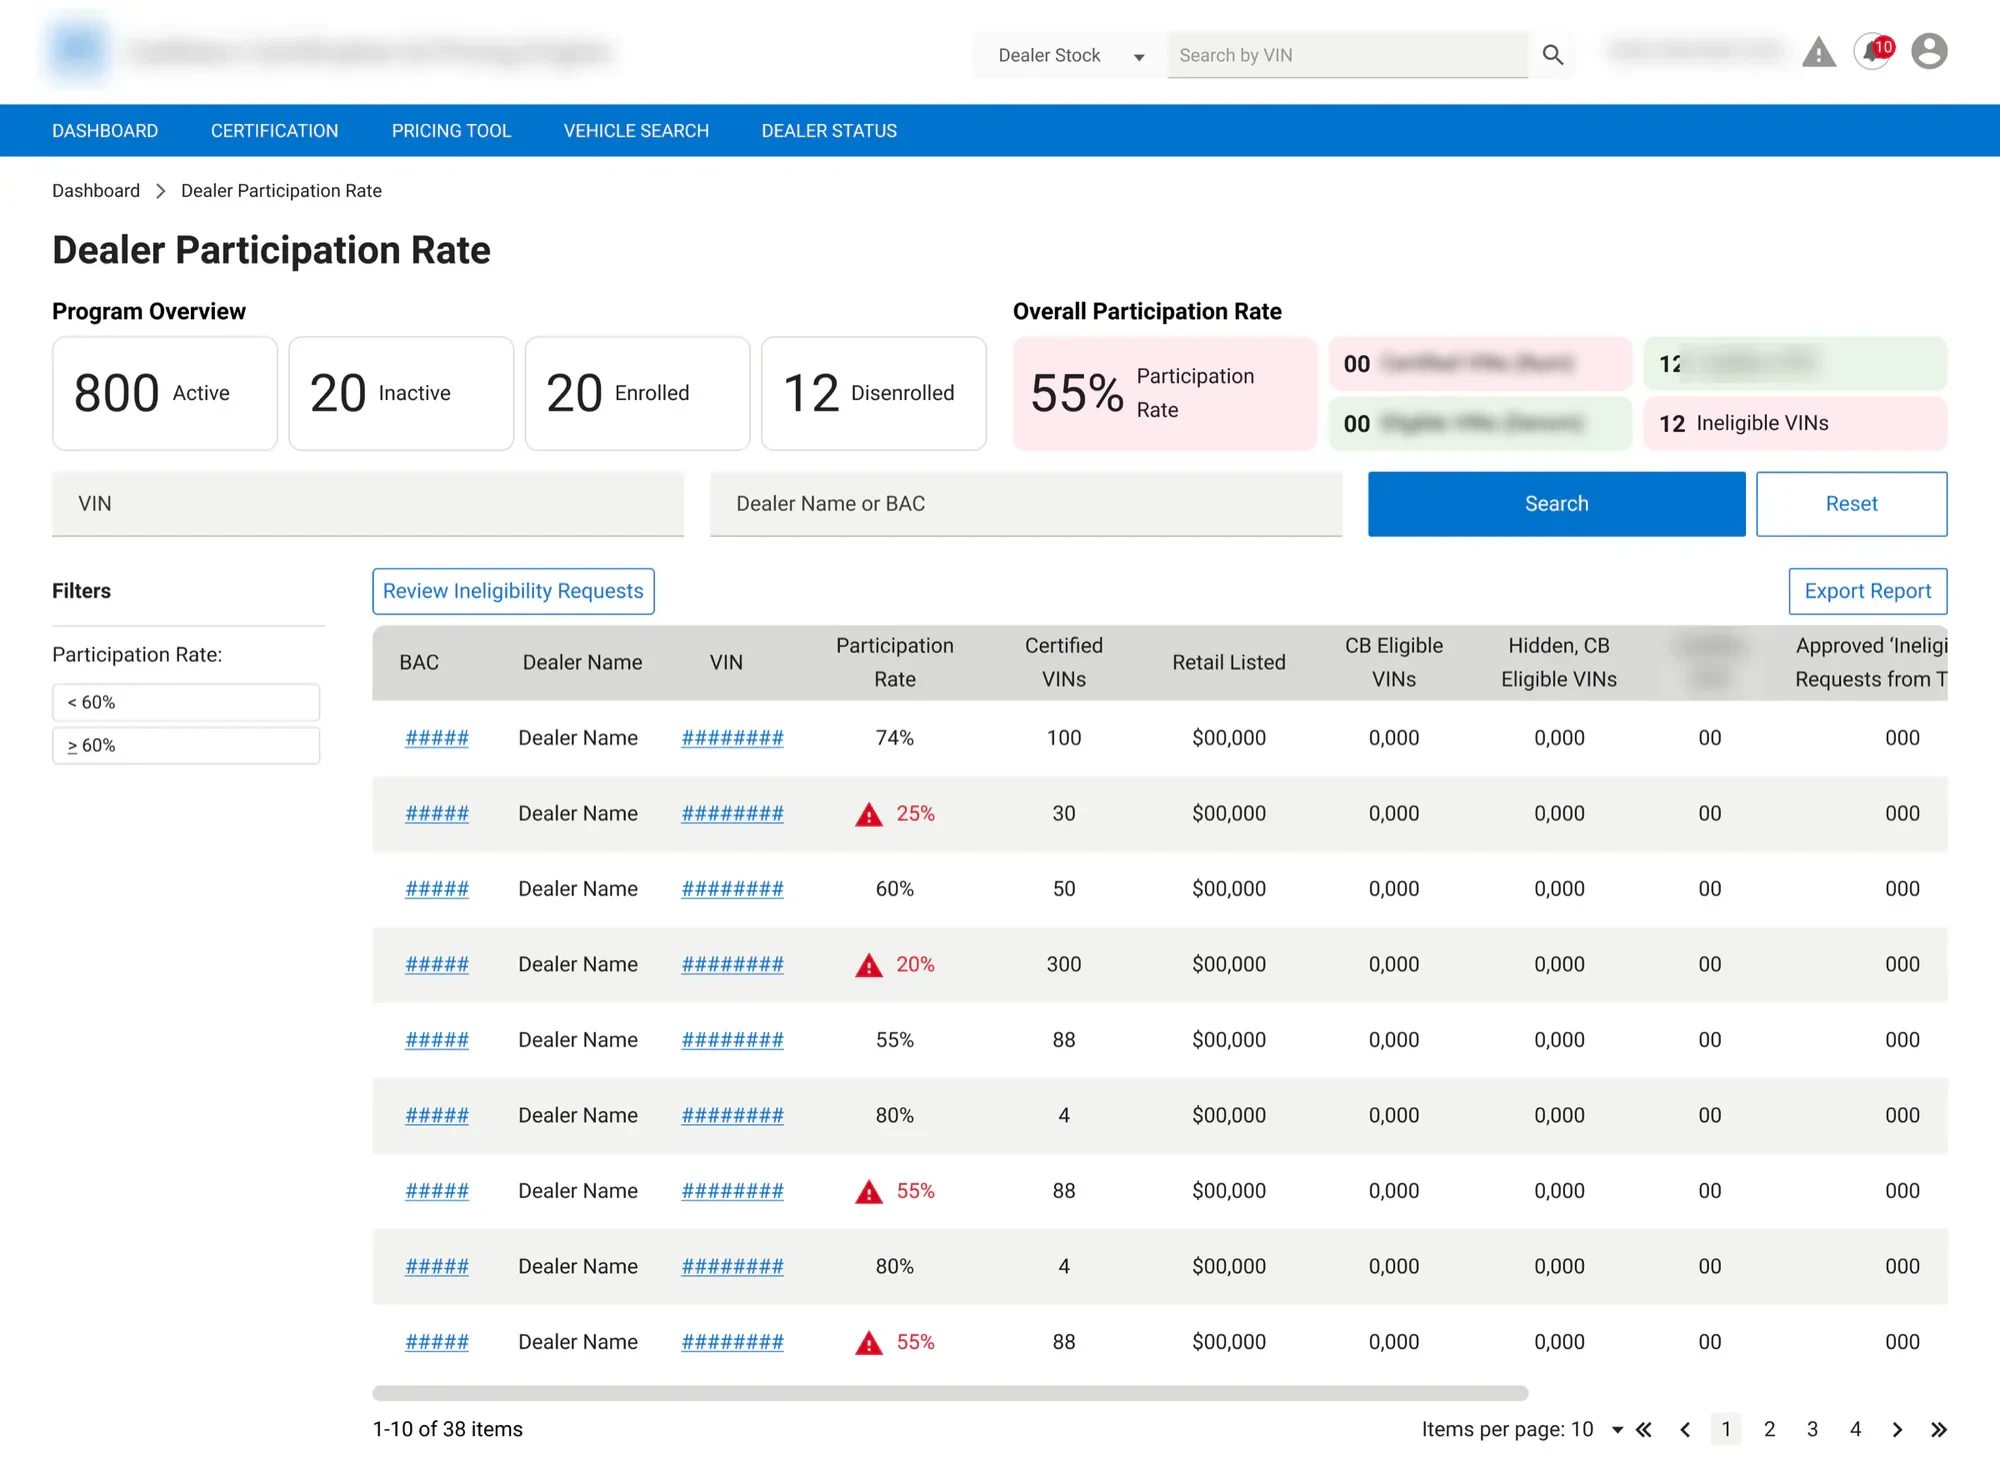
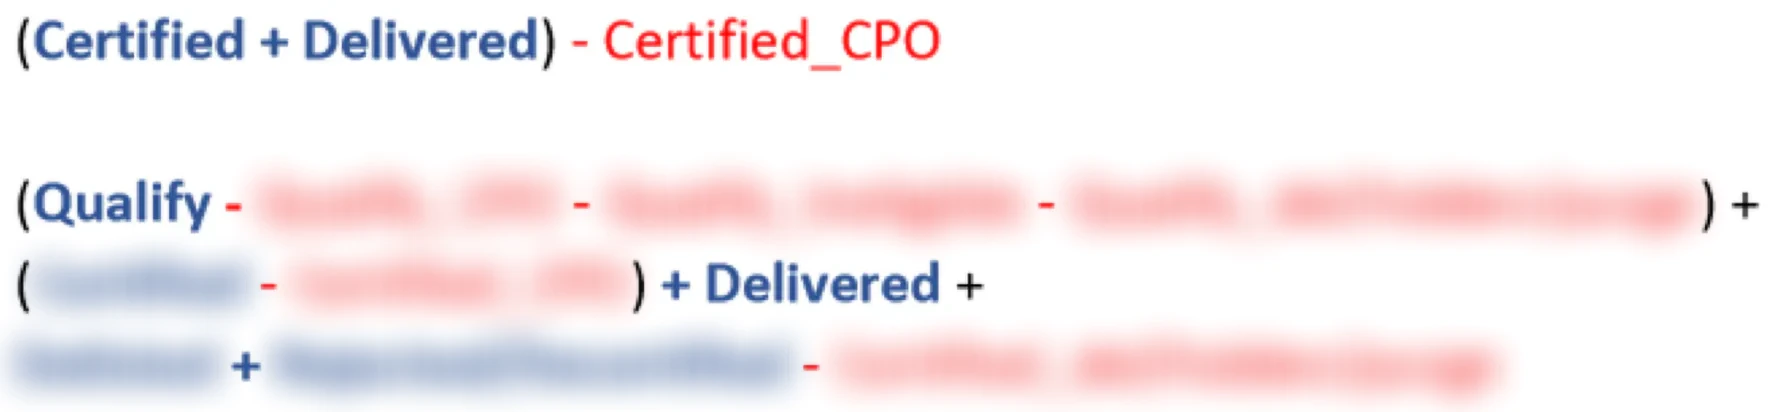
It was technically transparent, but a formula with eight variables didn’t make anything clearer. Even the business stakeholders couldn’t tell how the overview tiles related to each other. Part of the confusion came from two similar terms: dealers often thought a vehicle was certified when it was only qualified.
V1.1: One dealership at a time
What dealers wanted to know was “how am I doing?”, not how the whole program worked. So I moved to a dealership-level page with two tabs: one for the individual vehicles, and one for the participation rate overview, with a trend line and quarterly breakdown. This is also where I introduced the Days to EOQ and To Next Tier tiles, and links from any number straight to the vehicle behind it. Then I tested it with DZMs.
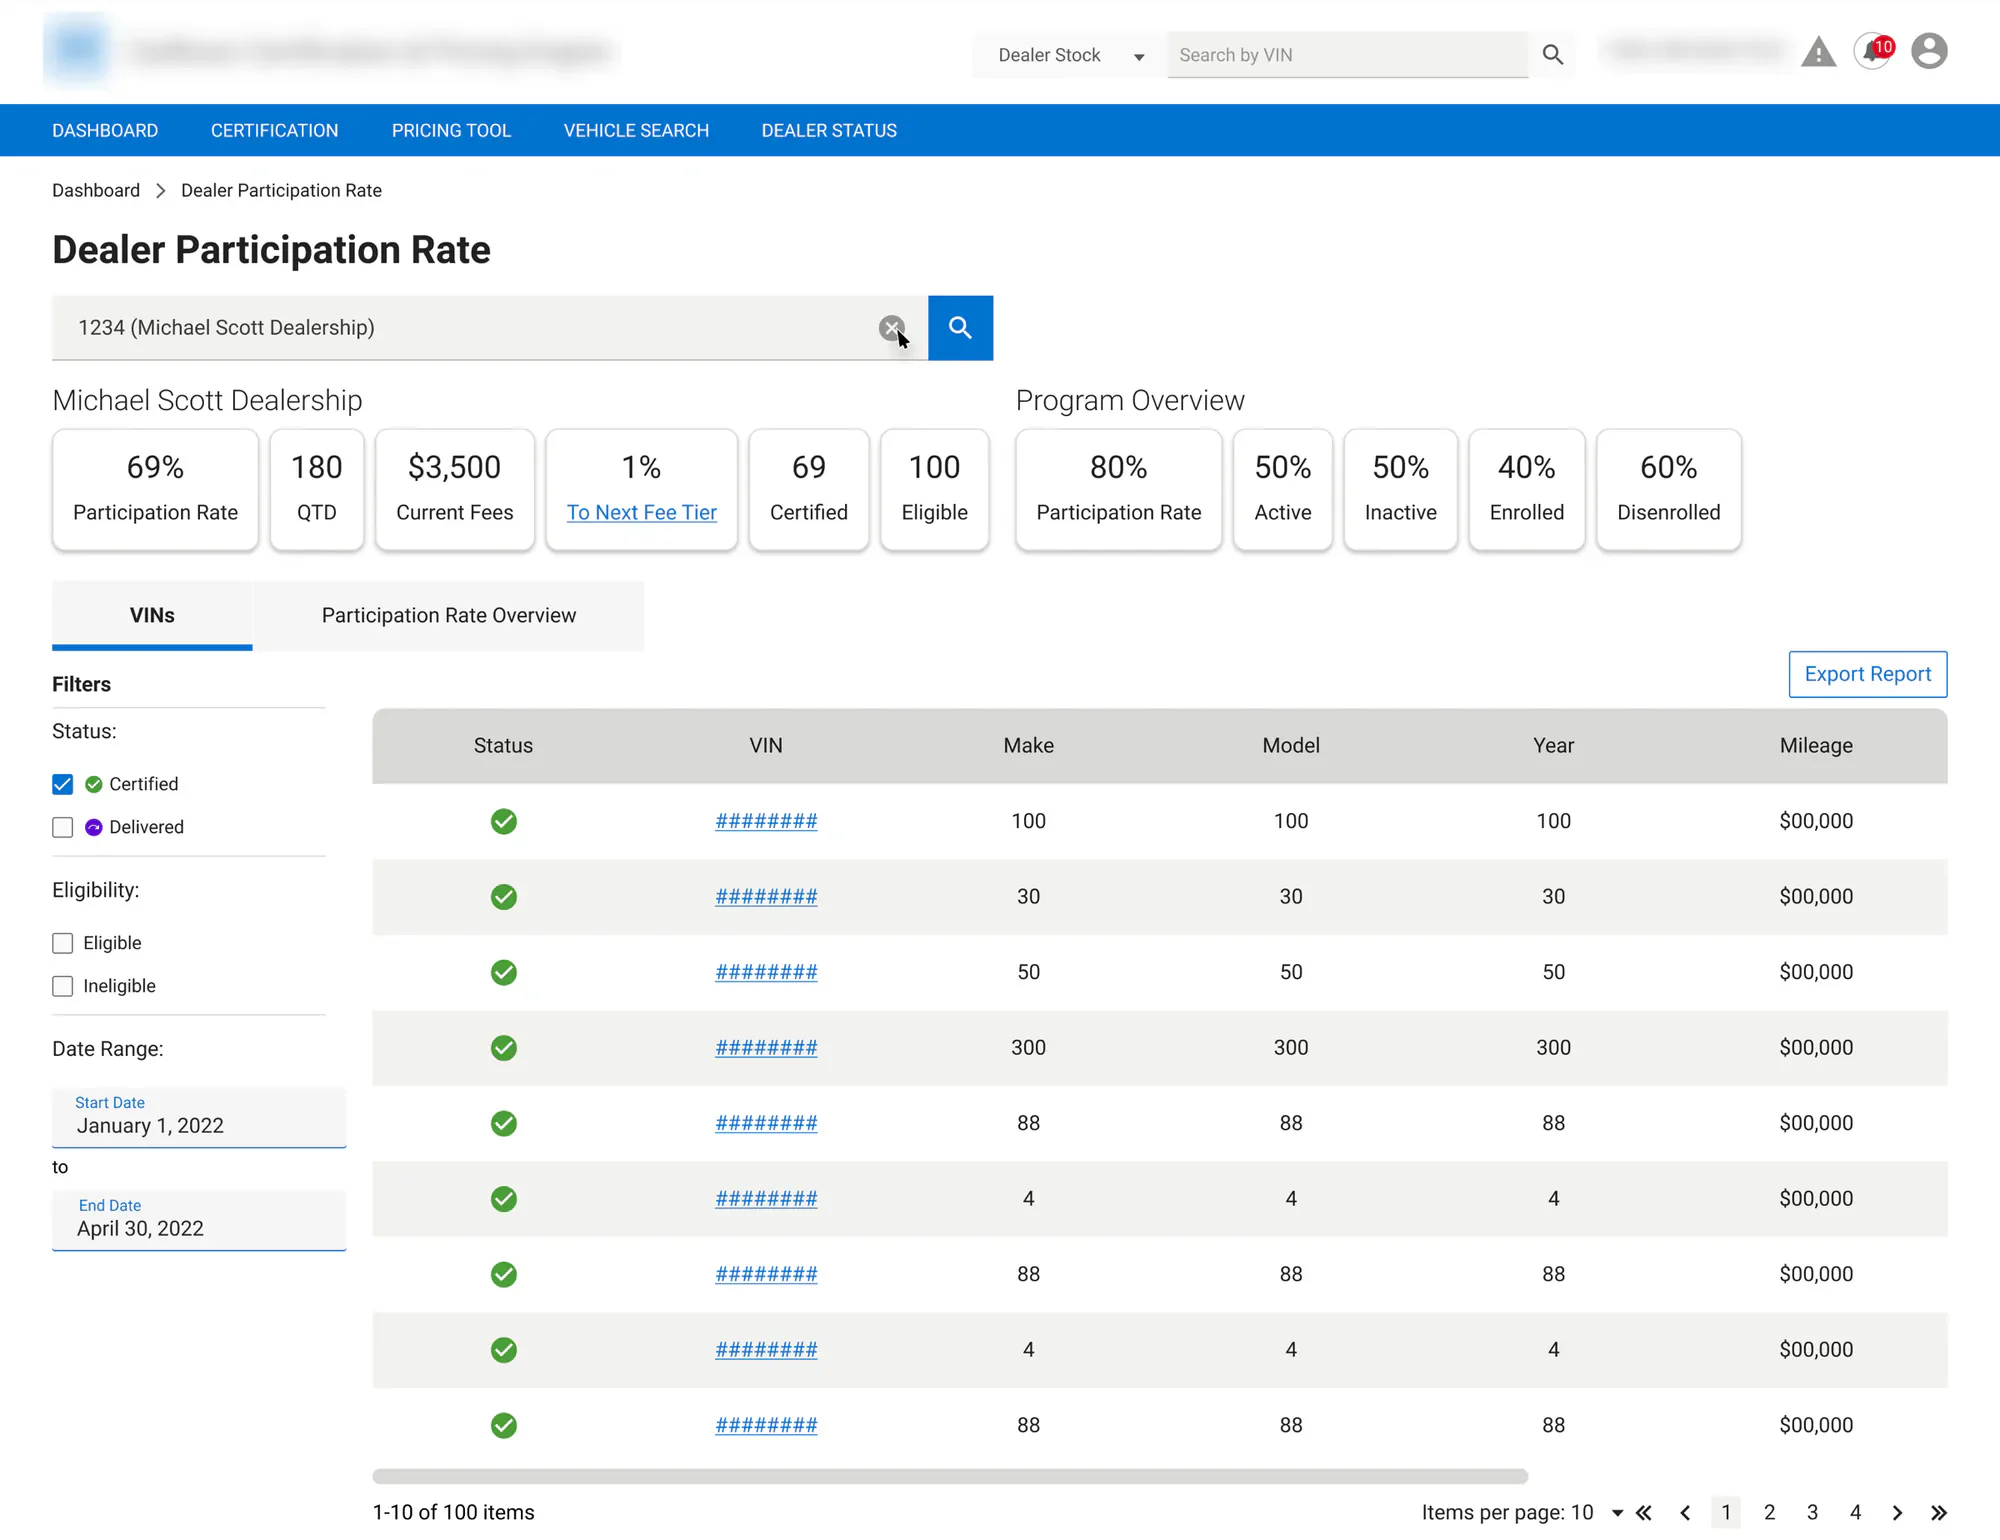
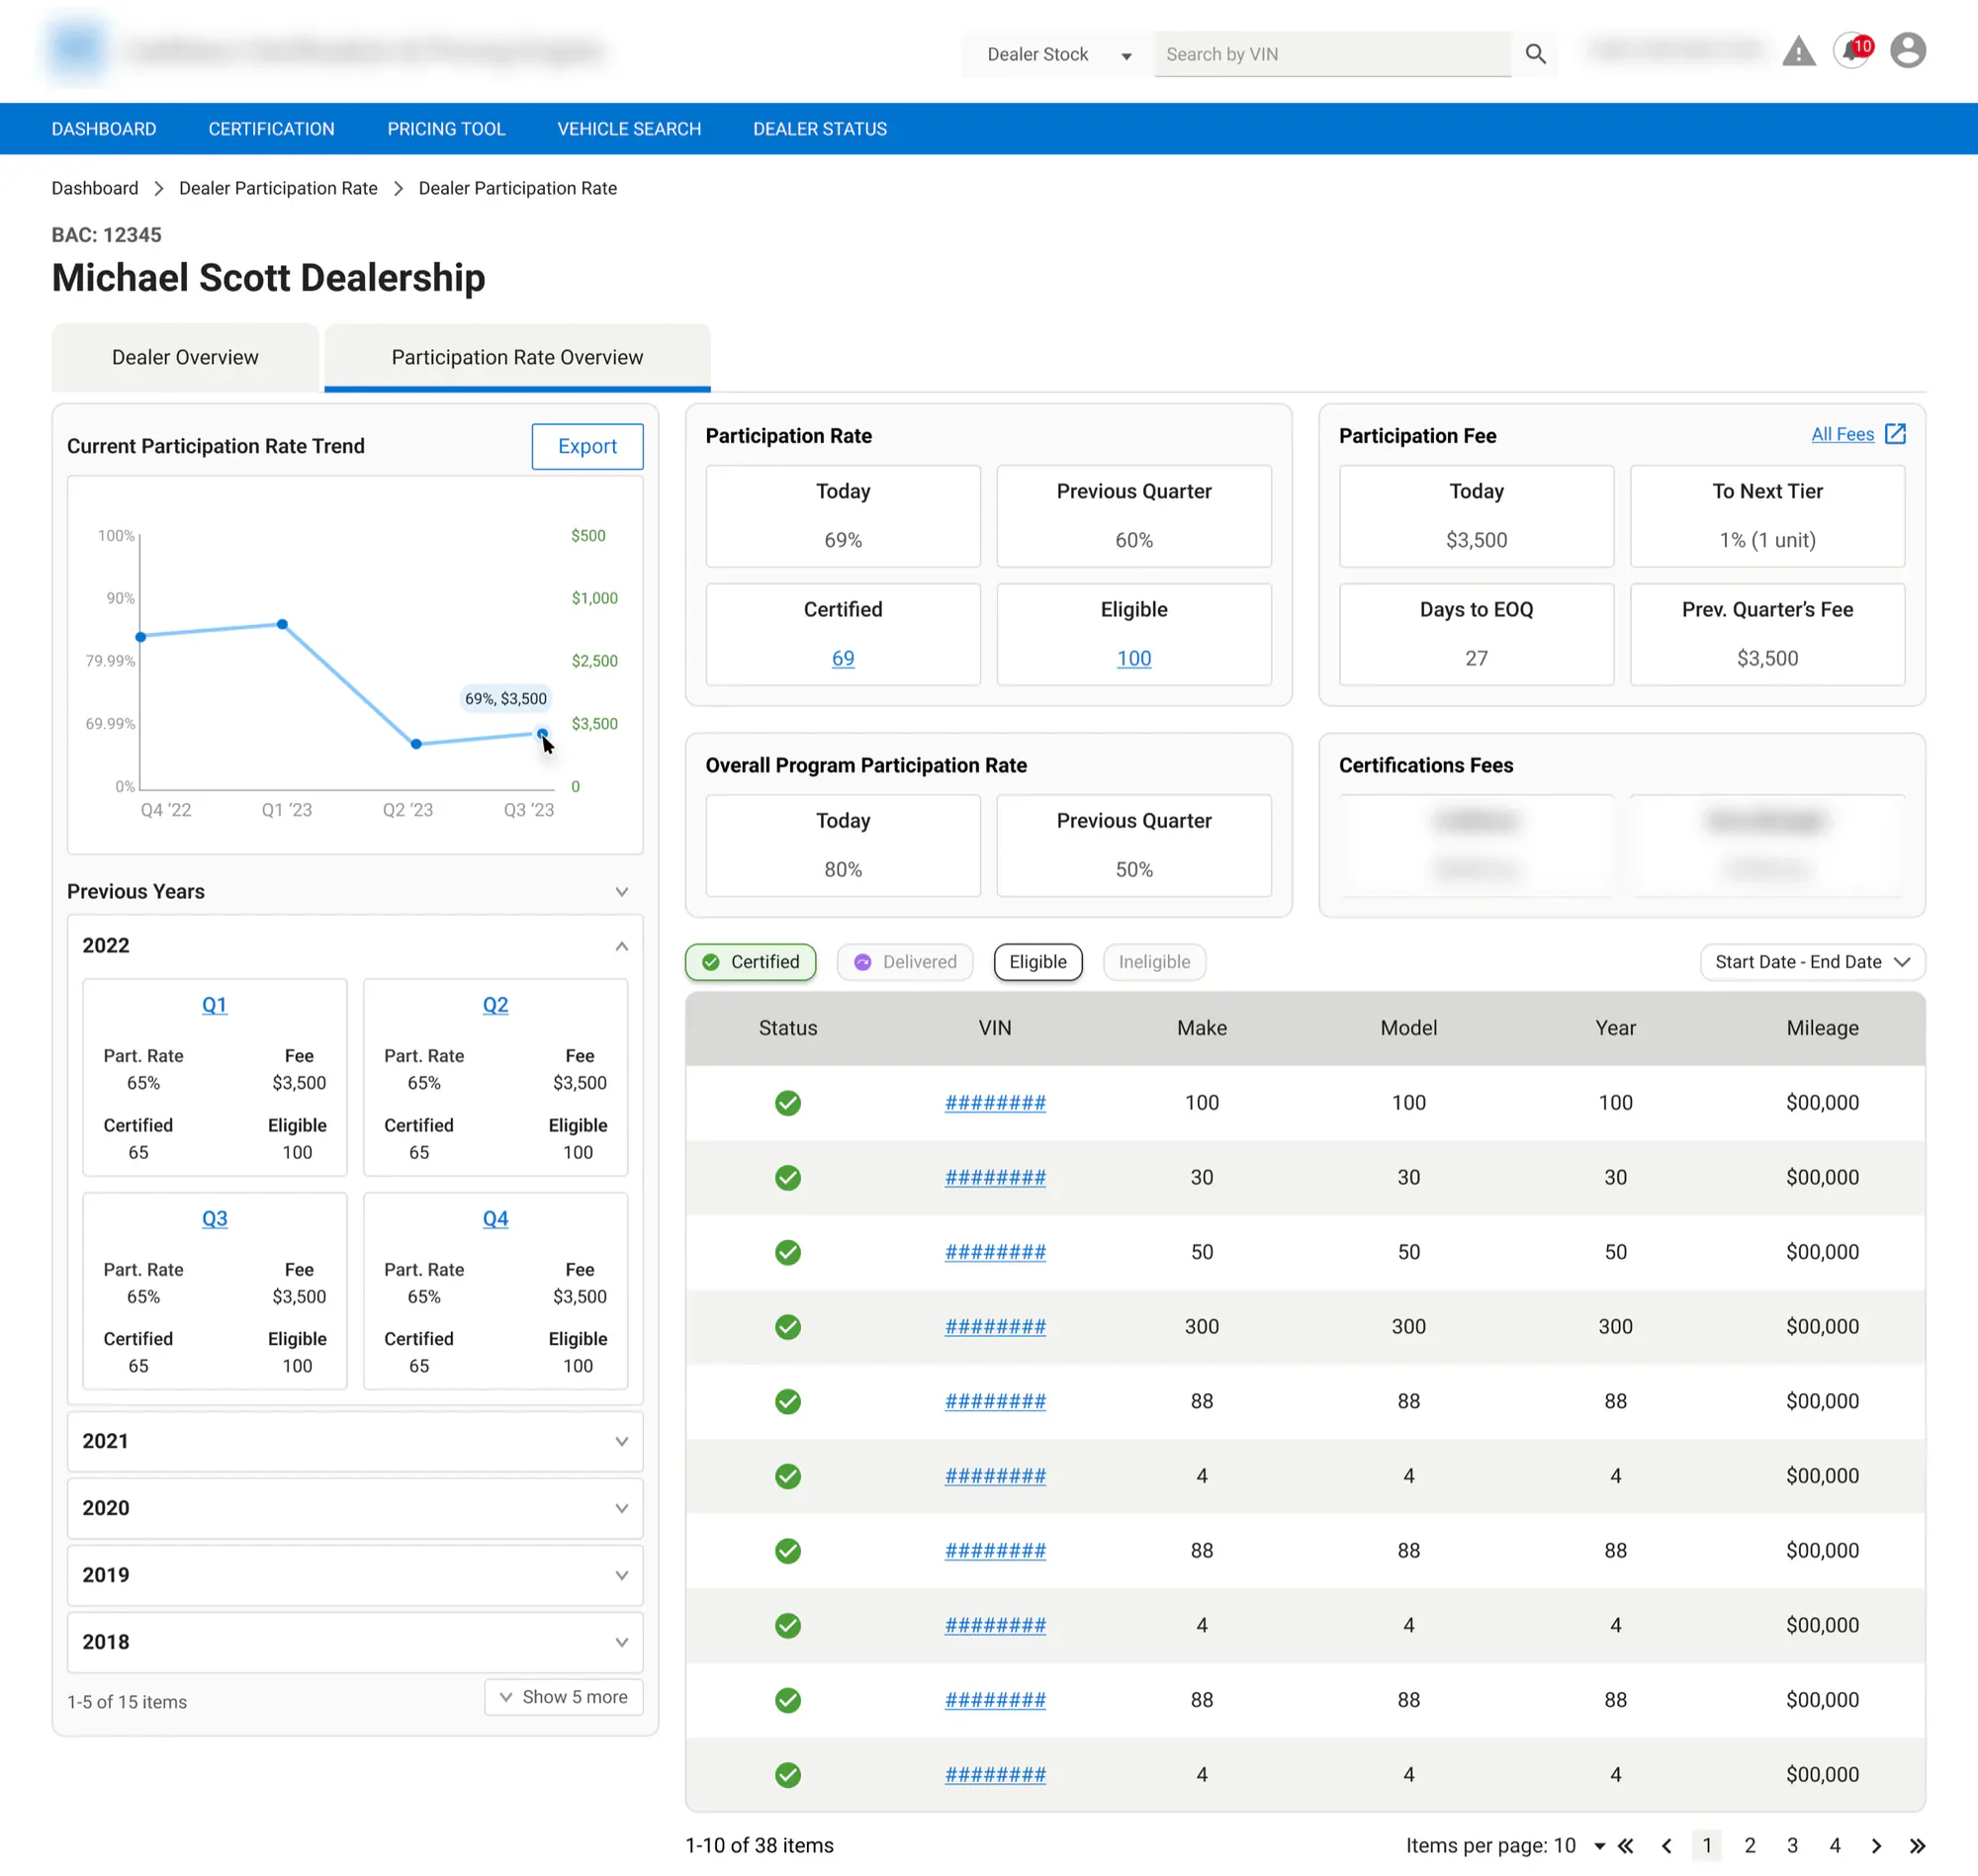
DZMs liked the new tiles, but the chart confused them:
I like the quadrant structure for the years… Only downside is, you’re having to mentally switch the appreciation for the value from the line graph to the quadrants. It’s visually confusing.
District Zone Manager
I had shown the same information two ways, and instead of reinforcing each other, they competed. I removed the charts and used a simple list instead.
V2 & V2.2: Rethinking the tabs
Users consistently wanted to see their vehicles and their rate in one view. Fitting everything on one screen got convoluted, so I moved fees into their own tab. That freed the overview to show the rate and the vehicles behind it together.
Testing this round taught me three things.
Findings and insights
- The filters weren't workingPeople couldn't tell whether a filter was on or off.
- Past fees weren't helpful, but potential savings wereUsers didn't care much about last quarter's fees, but they loved seeing what they could save.
- The fee structure had more detail than the brief describedThe quarterly history moved to the Fees tab, where that detail lived.
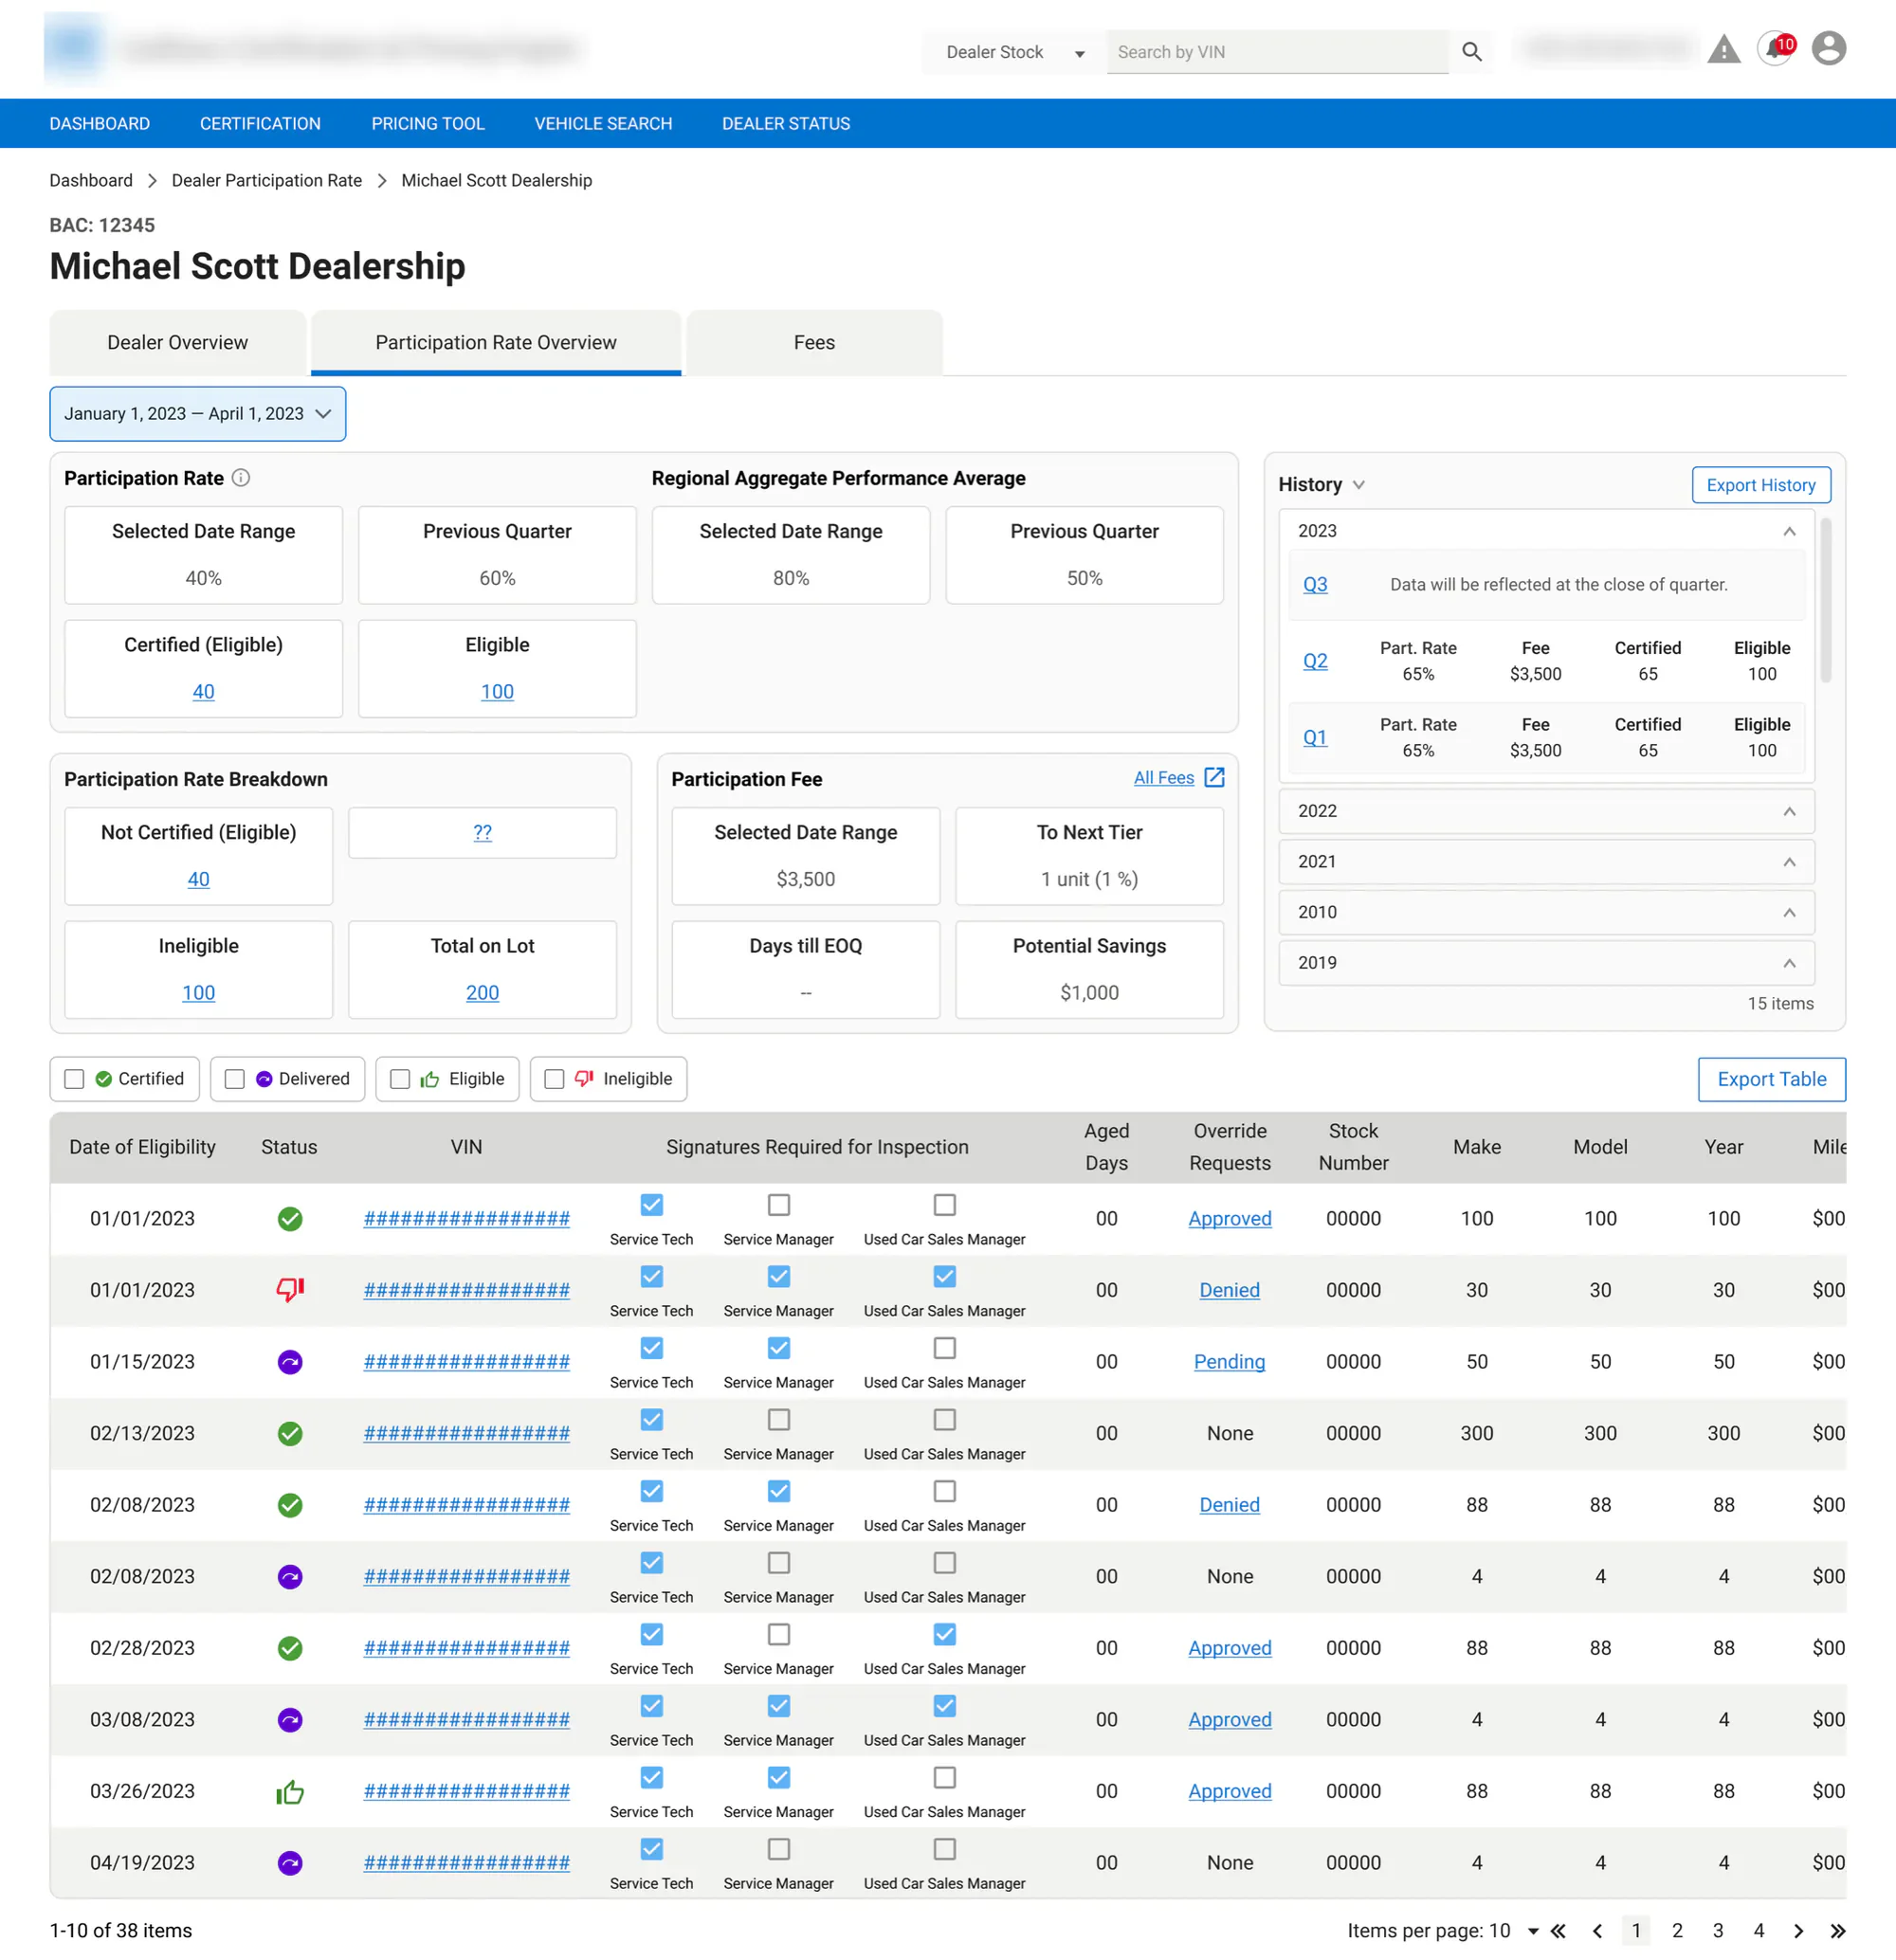
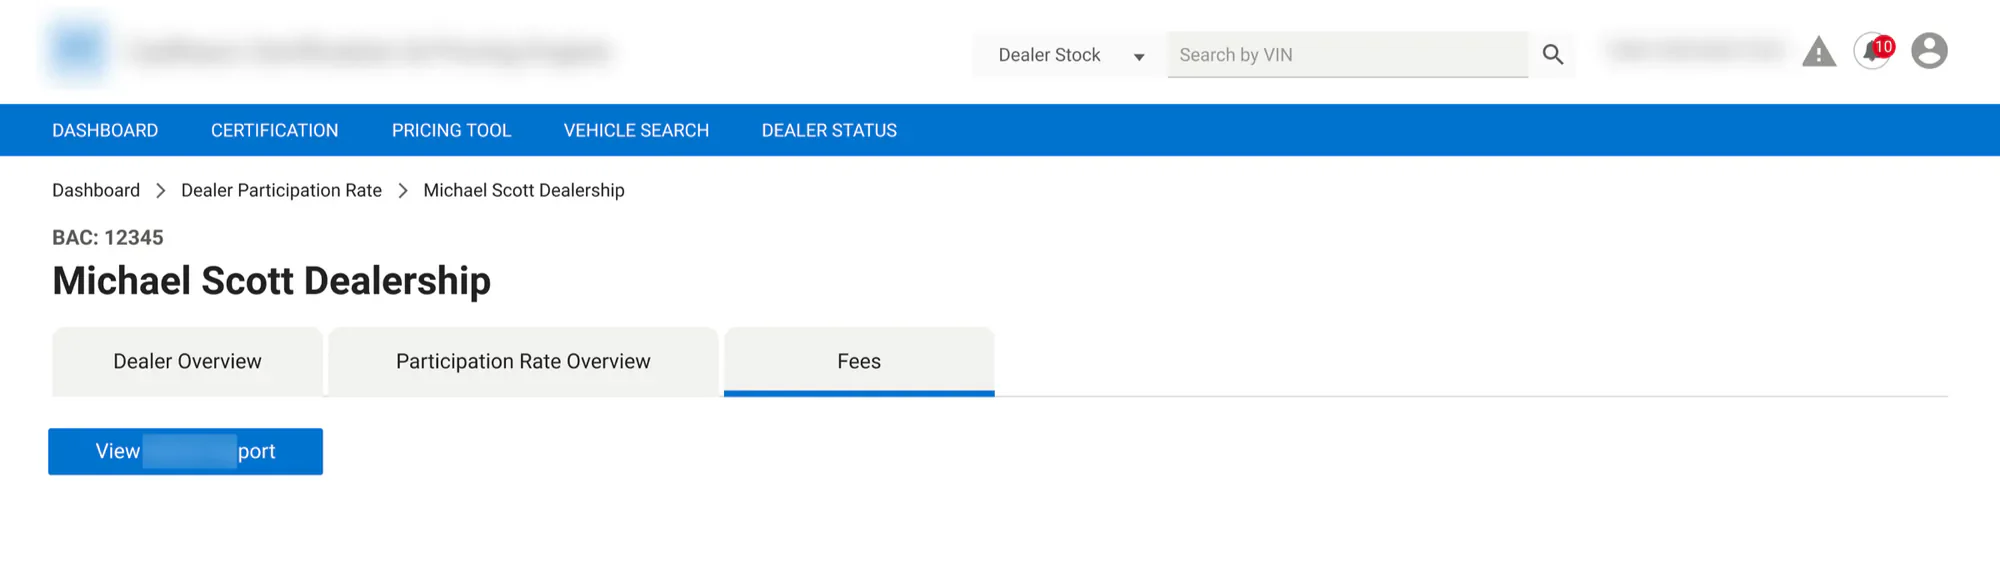
Final design: the MVP
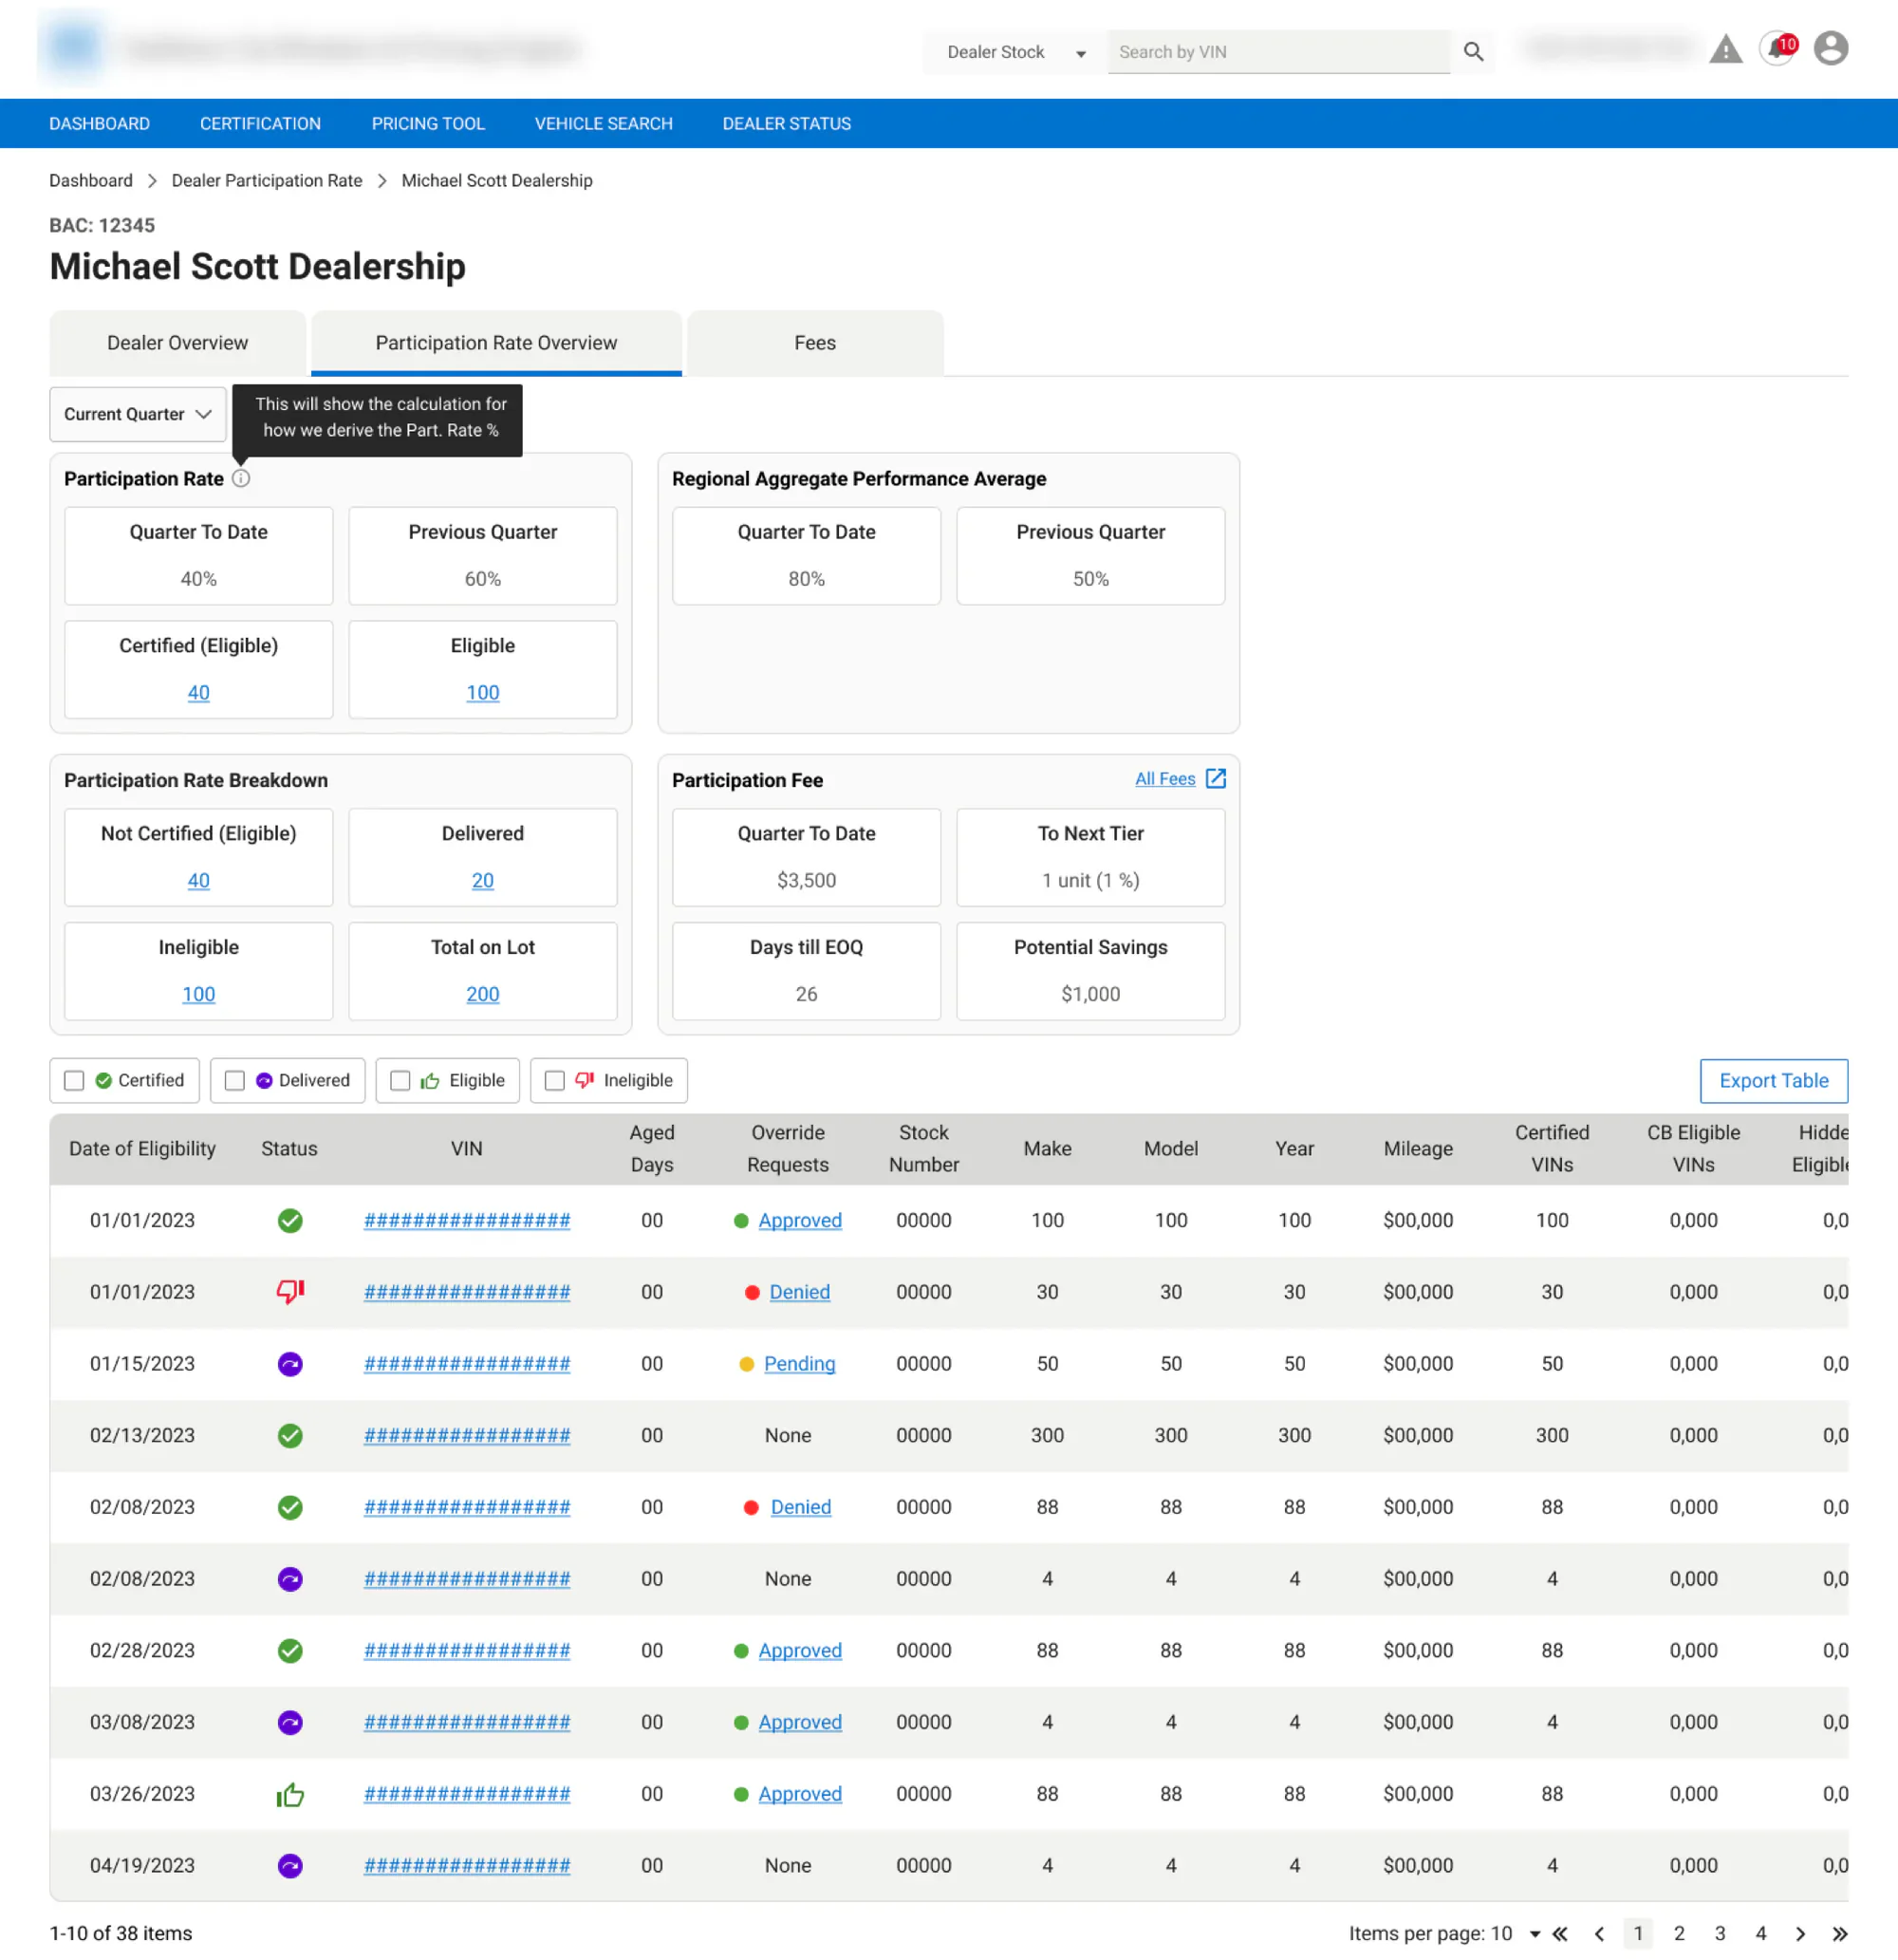
- Participation Rate Breakdown: the numerator and denominator in plain language: Not Certified (Eligible), Delivered, Ineligible, and Total on Lot, each clickable to filter the vehicles below.
- Regional average: how a dealer compared to others nearby, which also answered “is this consistent for everyone?”
- Participation Fee: Quarter to Date, Days to EOQ, To Next Tier, and Potential Savings.
- Vehicle table: each vehicle’s status, inspection status, and override requests. Inspection status was one of the most useful additions, because it shows dealers what they can do to raise their rate.
- Clearer filters, fixing the on/off confusion.
- A link to the existing fee report. Halfway through designing a detailed fee breakdown, I learned the company already had a tool that calculated fees for dealers. Mine was redundant, so I replaced it with a button that opens that report.
I also cut the quarterly history from the MVP. Business stakeholders wanted it to export into Excel, but DZMs didn’t need it day to day, so it stayed in the ideal-state design as a nice-to-have.
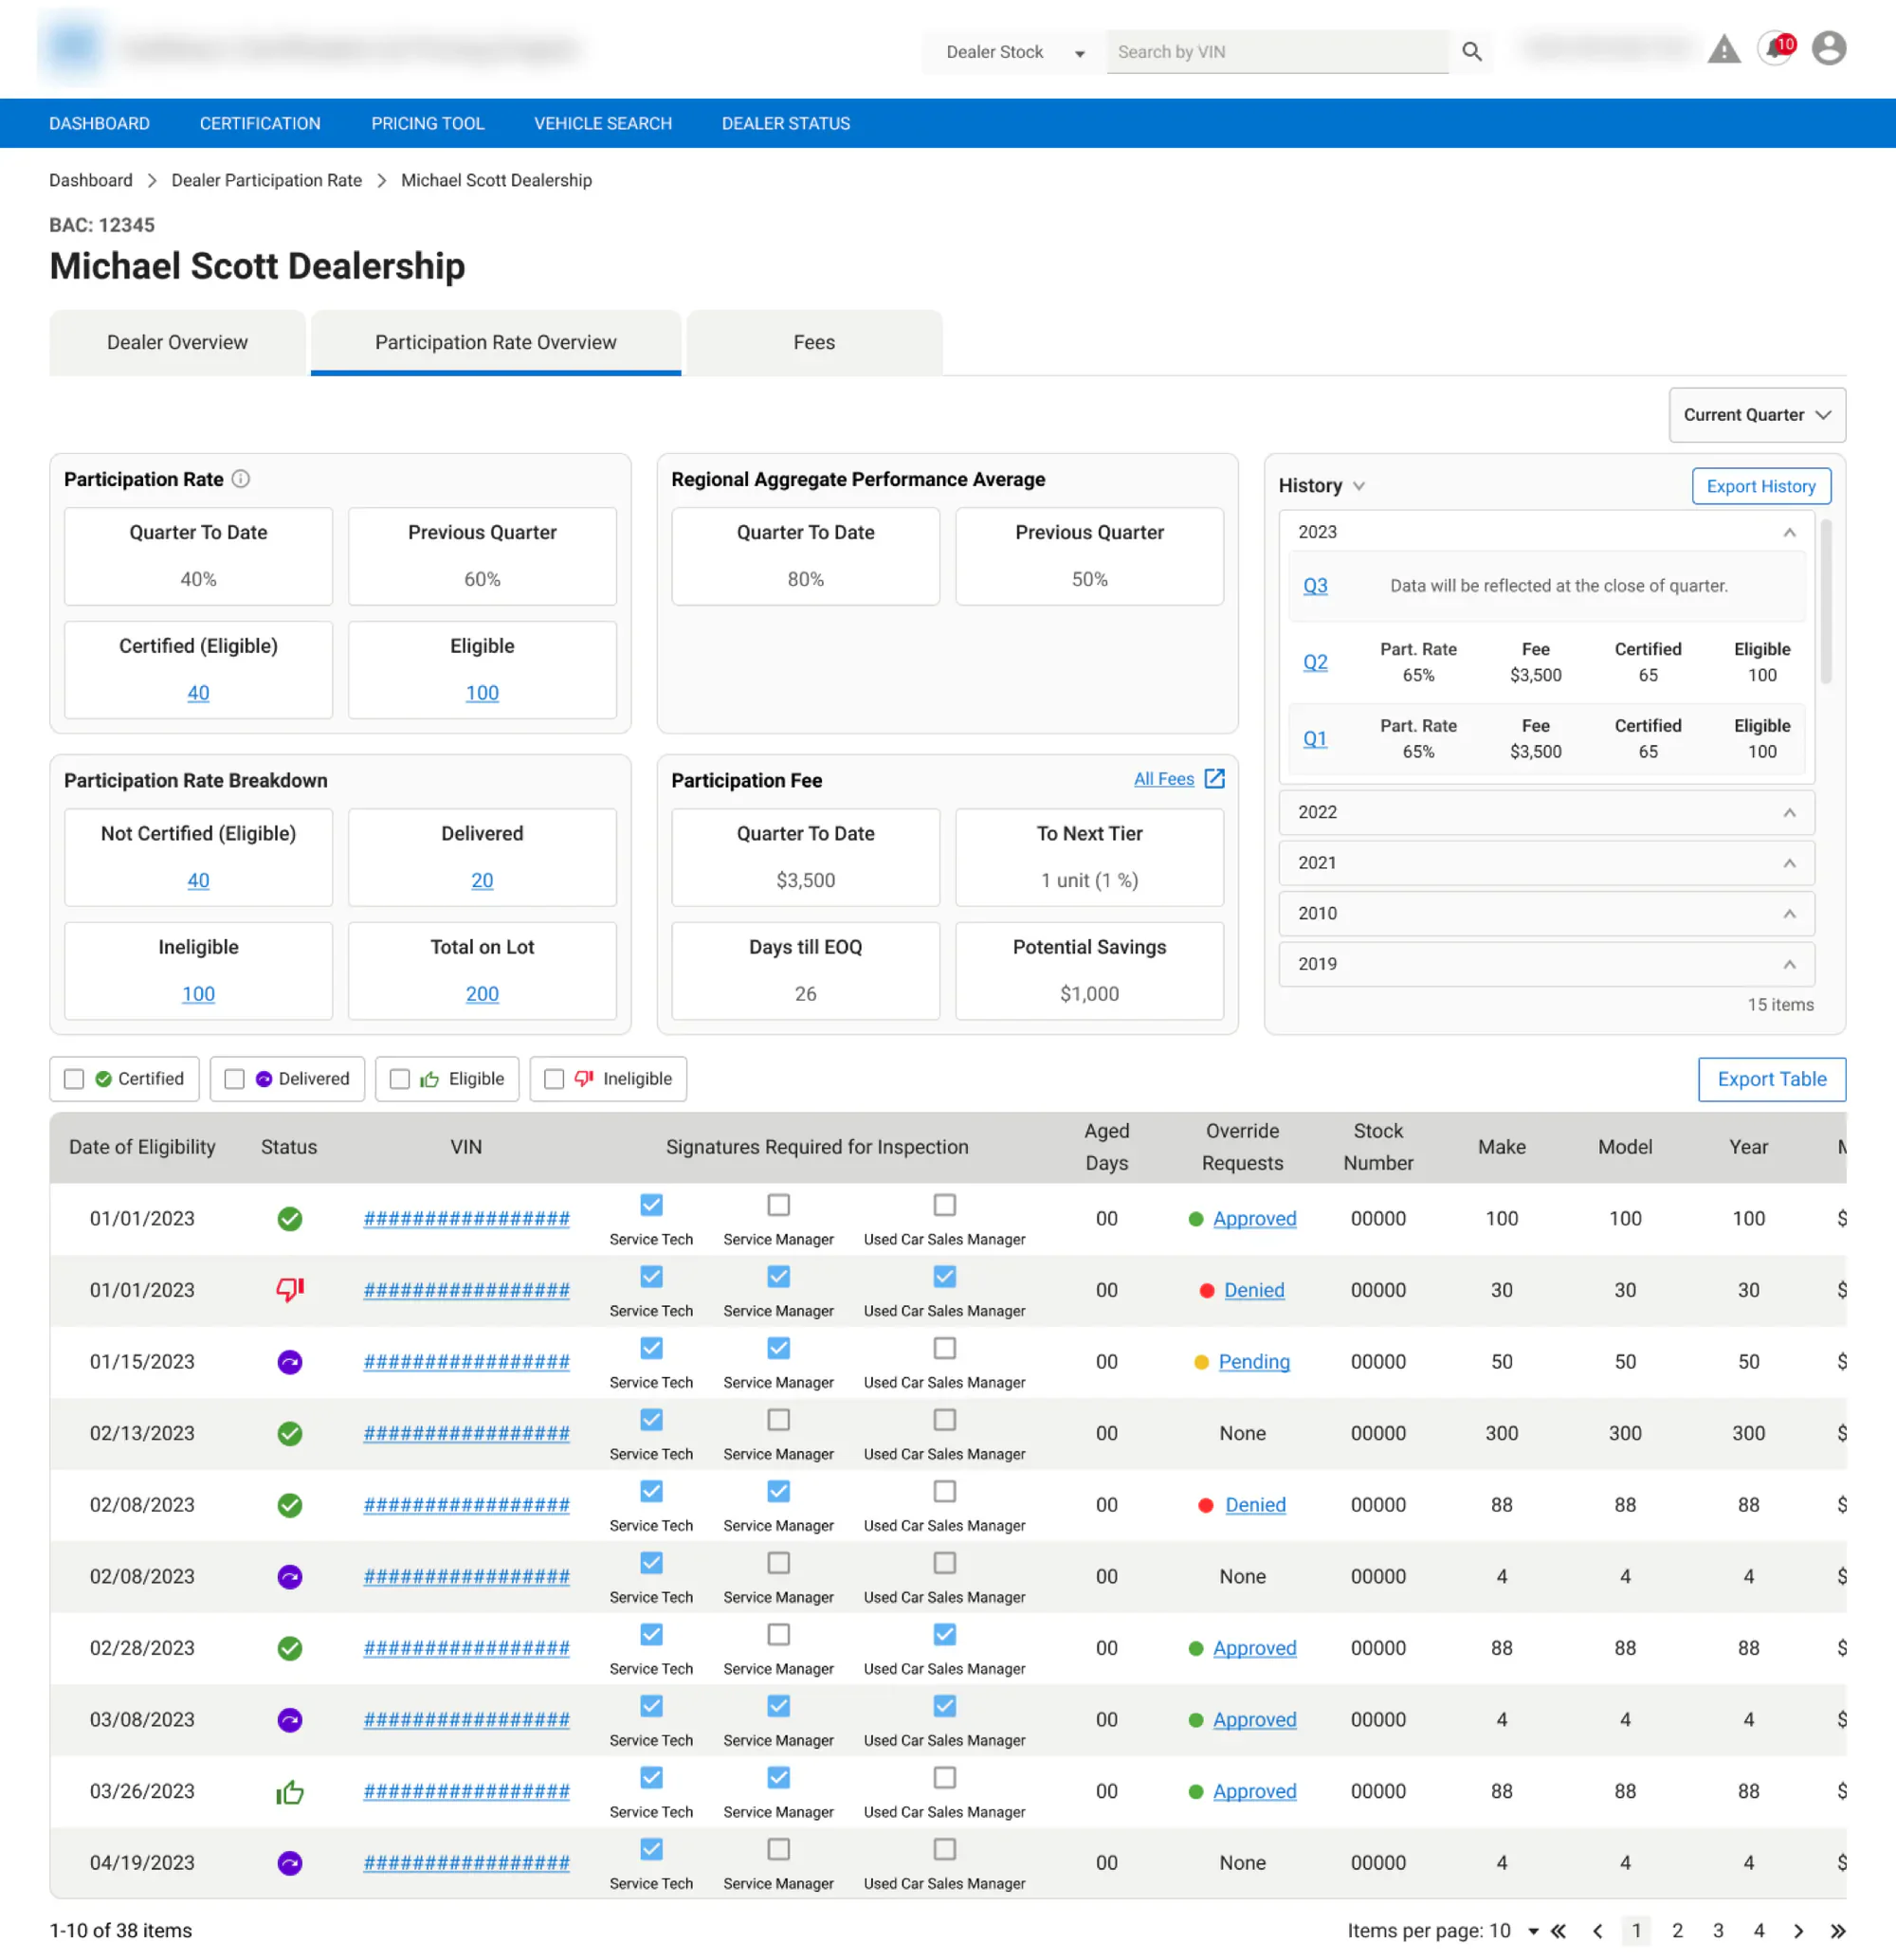
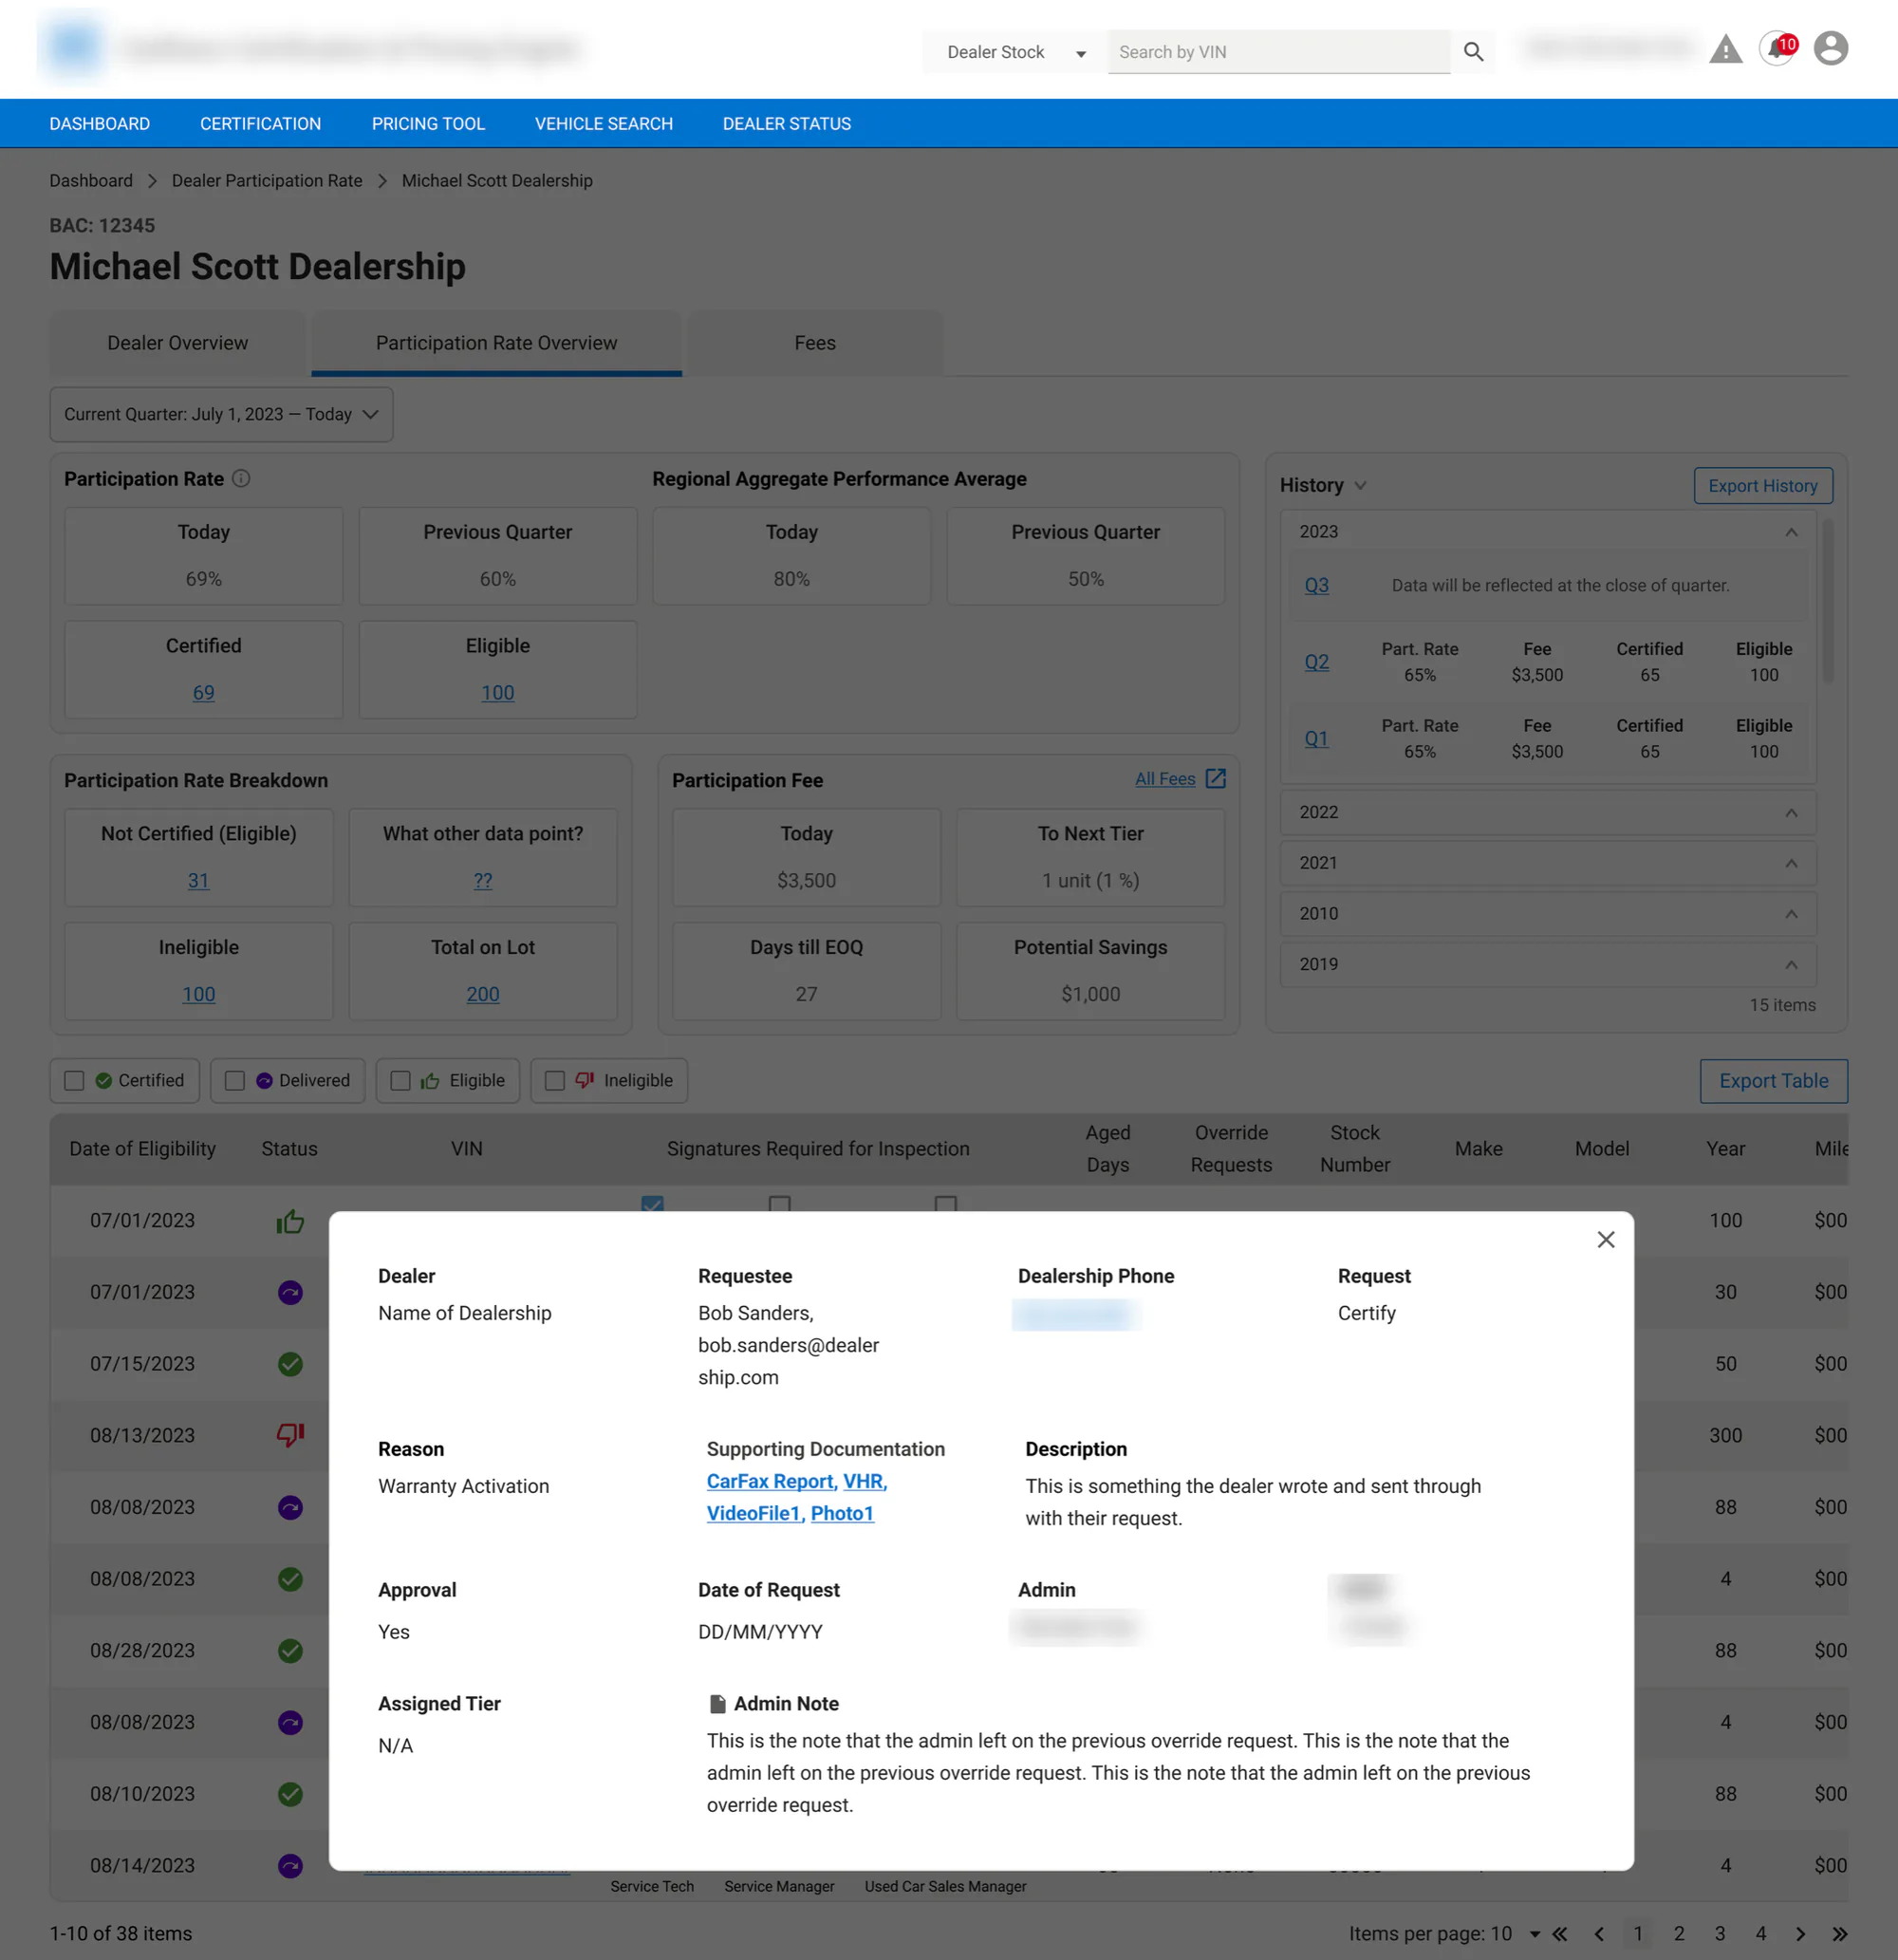
At the start, dealers didn’t understand why their rates were dropping. With this design, they can see every number, the vehicles behind it, and what to do next.
Managing deadlines
The project ran 6–8 weeks alongside my other work: a week to research and design, a week of feedback, then three weeks of designing, scheduling, and testing each new round.
The other two weeks were mostly scheduling. DZMs are in the field with dealers all day, so finding time with them was hard and kept threatening the timeline. My background in sales and client management helped here. I followed up until sessions were on the calendar, and I set clear expectations about when I needed feedback and what kind, and used asynchronous tools so people could respond on their own time. That kept the project on track without skipping research.
Impact
I designed the MVP and handed it off to engineering before I left in September 2024. The design:
- Gave dealers transparency into how their rate was calculated and which vehicles were helping or hurting it
- Gave DZMs a coaching tool, with motivating numbers (days left, distance to the next tier, potential savings) they could bring straight to their dealers
It hadn’t launched when I left, so I don’t have post-launch numbers.
How I’d measure success
- Fewer “why did my rate drop?” support requests to the program team
- Tier movement: how many dealers reach the next tier after DZM coaching
Key learnings
Design for the outcome, not just the problem statement. The brief asked for transparency. What dealers and DZMs needed was a reason and a way to improve.
Show what people need to decide. My first version showed everything. The final version shows what people need to make a decision, and lets them dig deeper if they want to.
When it comes to data, test very specifically. Asking “Is this clear?” usually gets a yes. Asking “What would you tell a dealer who’s at 64% with 27 days left?” shows you whether they understand it.
Ask what already exists before you design. I spent time on a fee breakdown that an existing tool already did better.
Sometimes there’s no perfect solution when different user groups share one tool, and that’s OK. Dealers, DZMs, and stakeholders wanted slightly different things. My goal was to make it useful for all of them.